Portfolio intelligence, from spreadsheet to boardroom.
Pharion turns the spreadsheets your portfolio companies already send into live KPIs, fund performance, and board-ready reporting. A quarter close that took a week takes an afternoon.
The quarter shouldn’t run on email attachments.
Your data lives in email attachments.
Every quarter, KPIs arrive in twenty different Excel formats and die in a shared drive.
Your board pack takes a week.
Analysts re-key numbers into slides; the numbers are stale before the meeting starts.
Your value-creation plan is a PDF.
Hundred-day plans get written once and never tracked against actual performance.
One system, seven rooms
Every tab of the product is a room — each one opens as a guided, code-animated walkthrough ending on a real product screenshot.
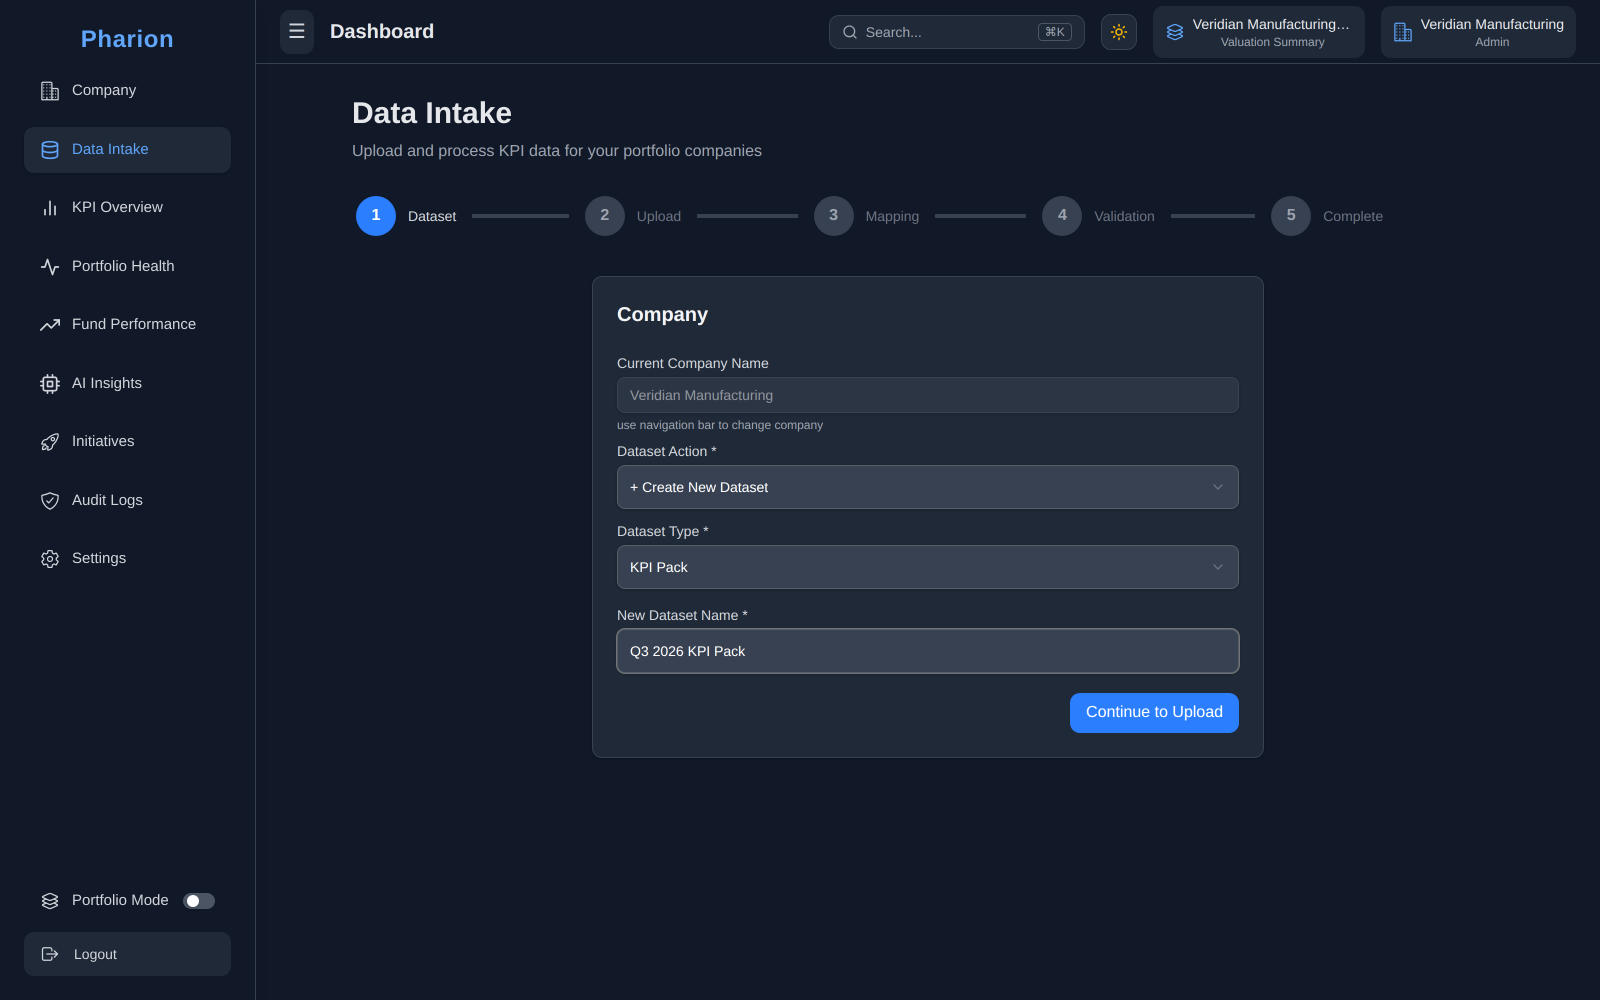
Data Intake
Excel, CSV and board packs, mapped once and remembered every quarter.
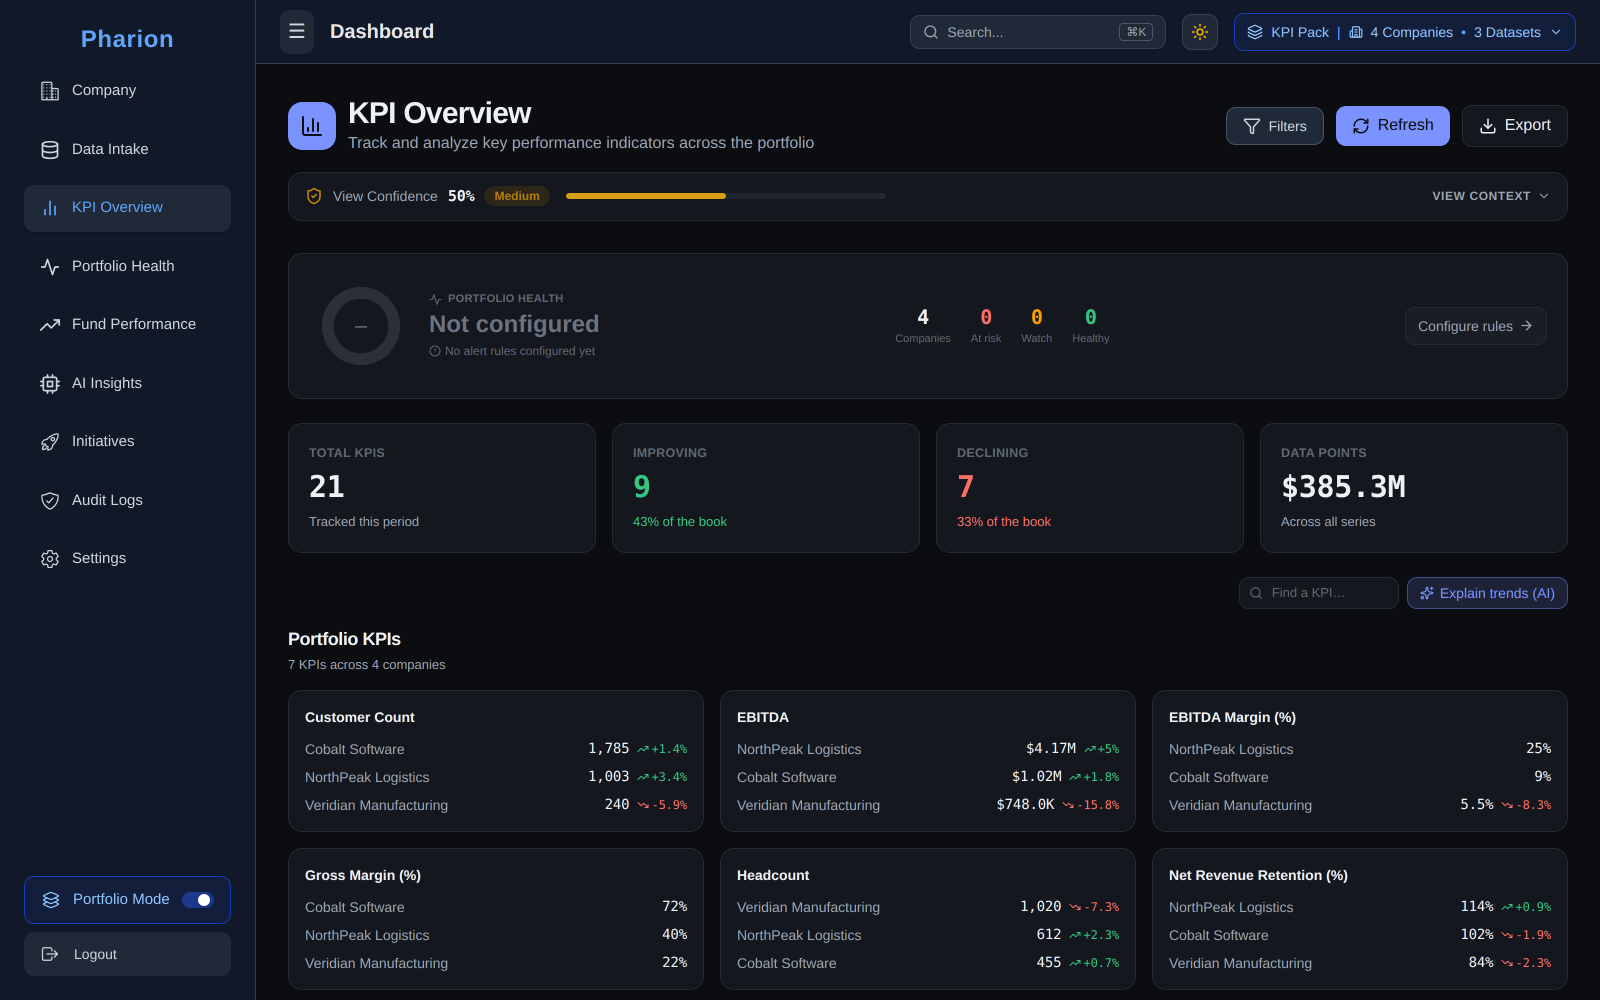
KPI Overview
Live dashboards per company or across the whole portfolio.
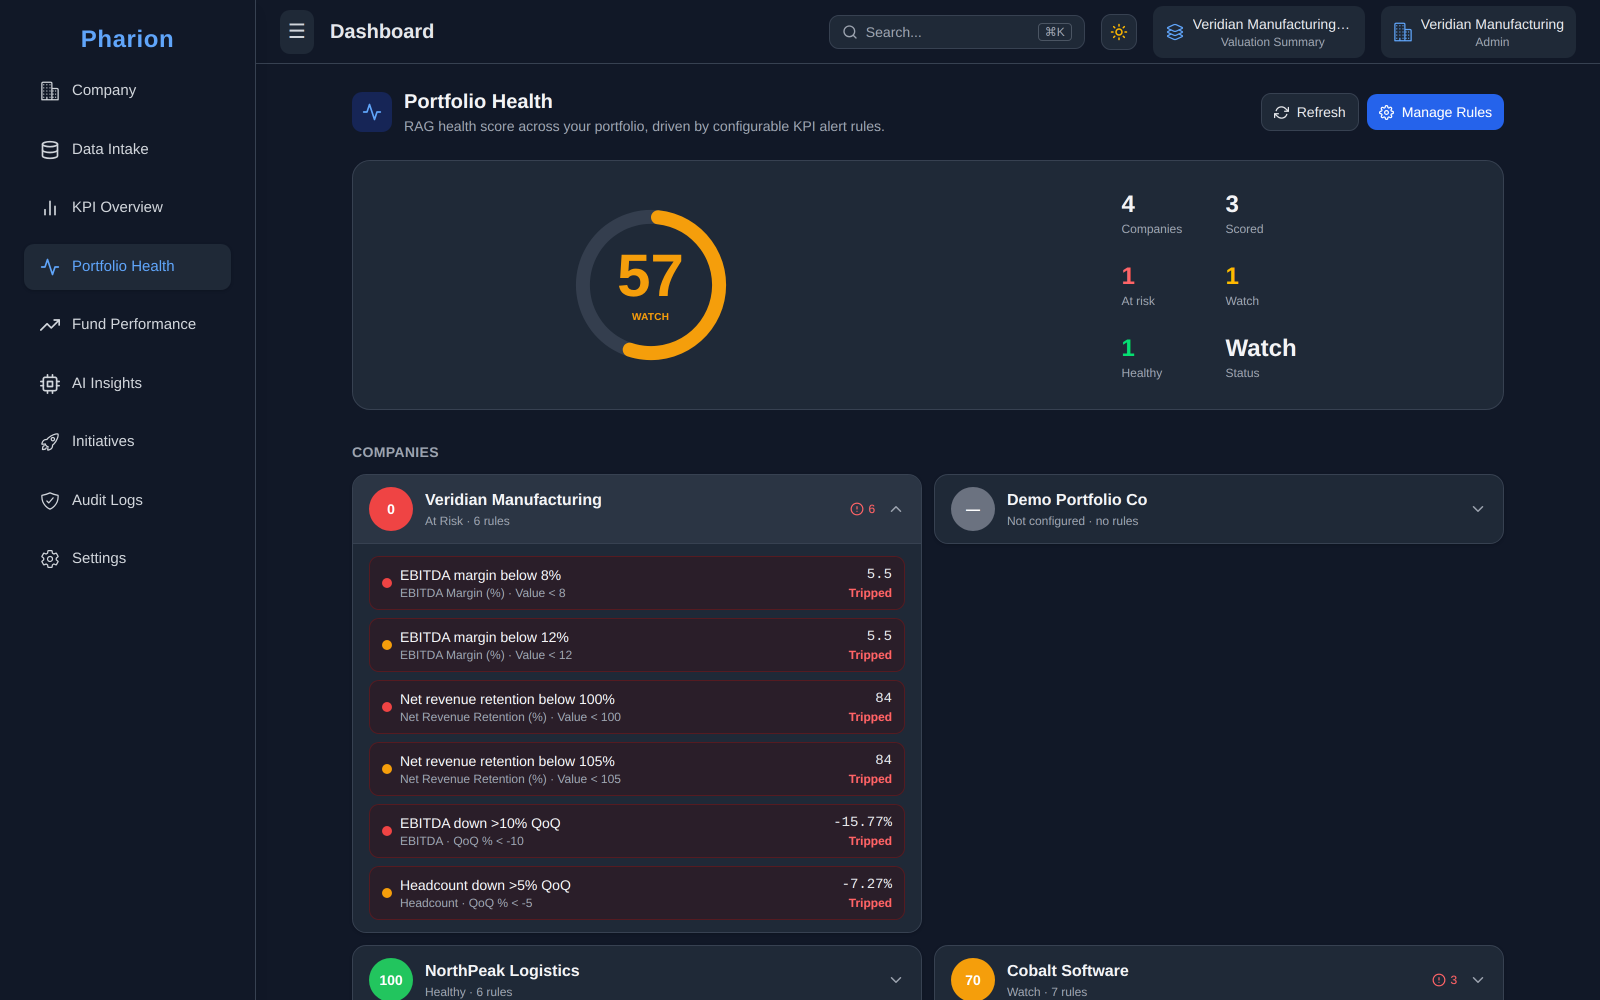
Portfolio Health
A 0–100 early-warning score per company, from alert rules you configure.
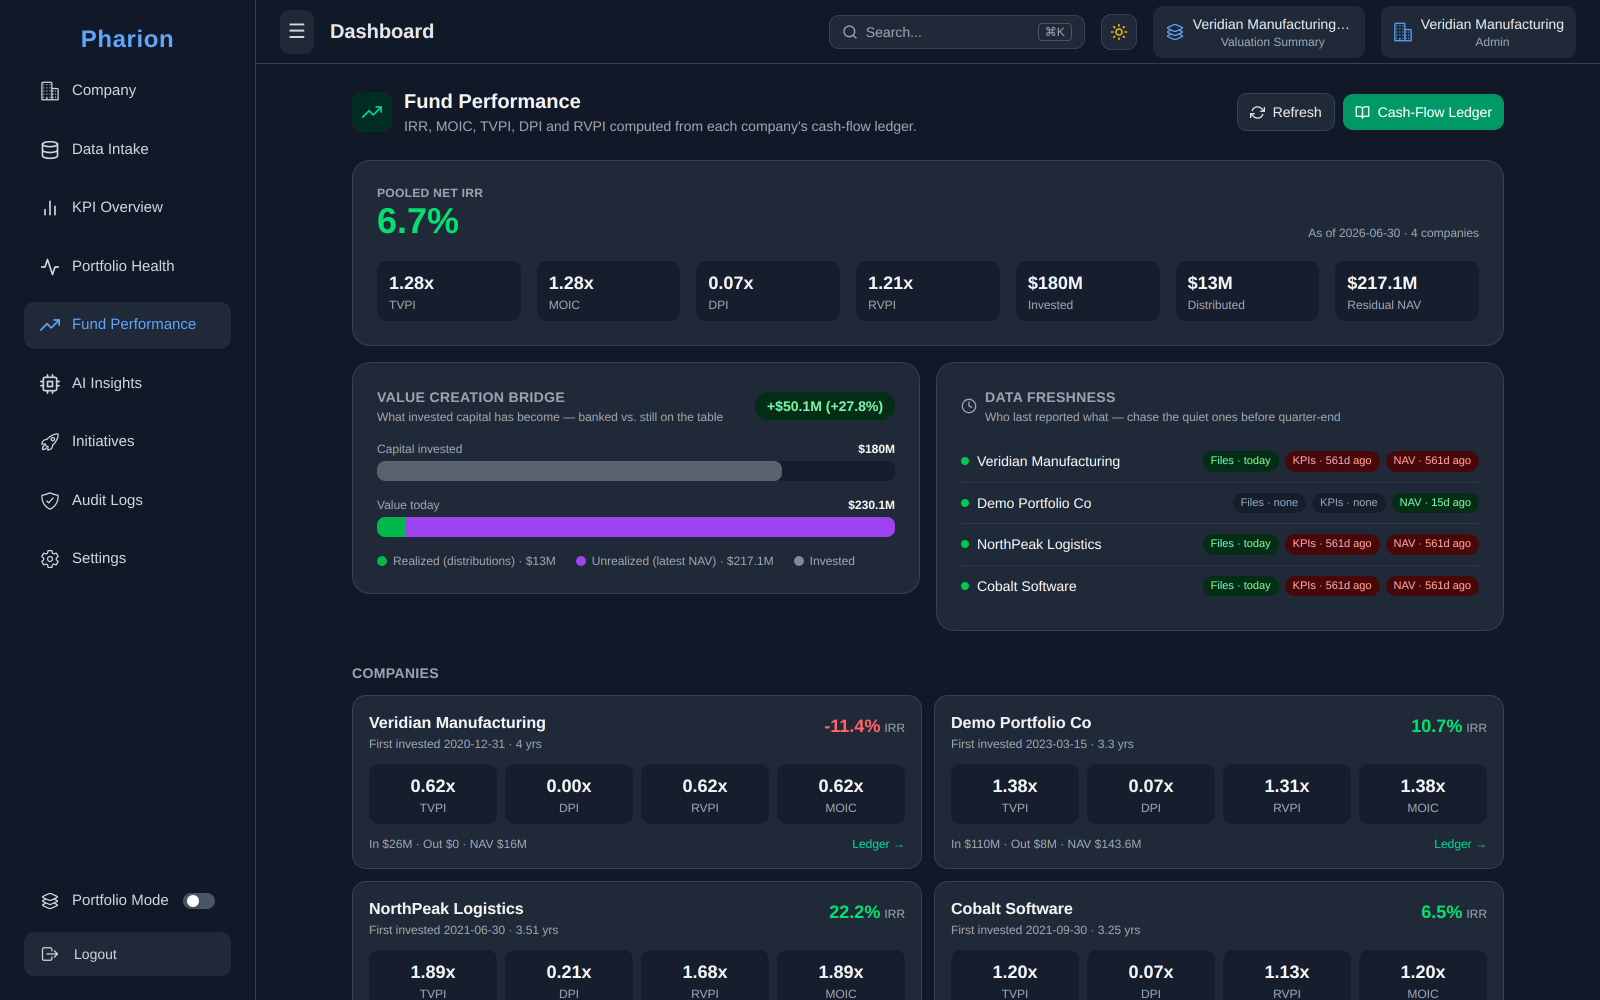
Fund Performance
Net IRR, TVPI, DPI and RVPI computed from a real ledger.
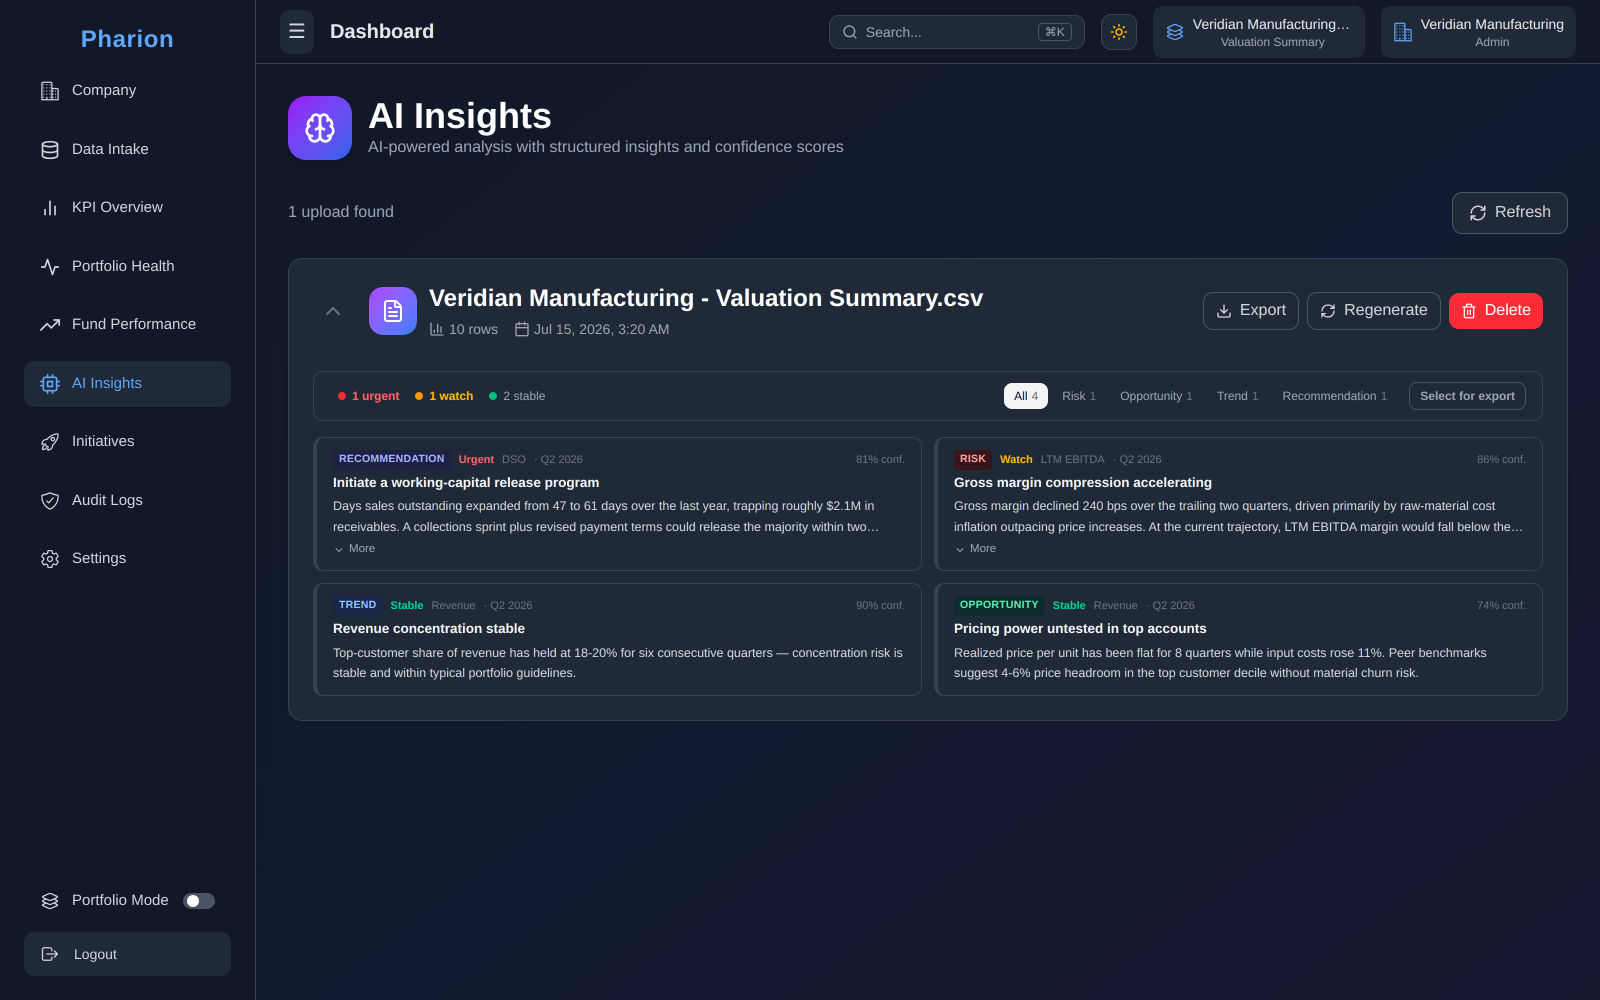
AI Insights
Written commentary on every variance, generated inside your own Azure tenant.
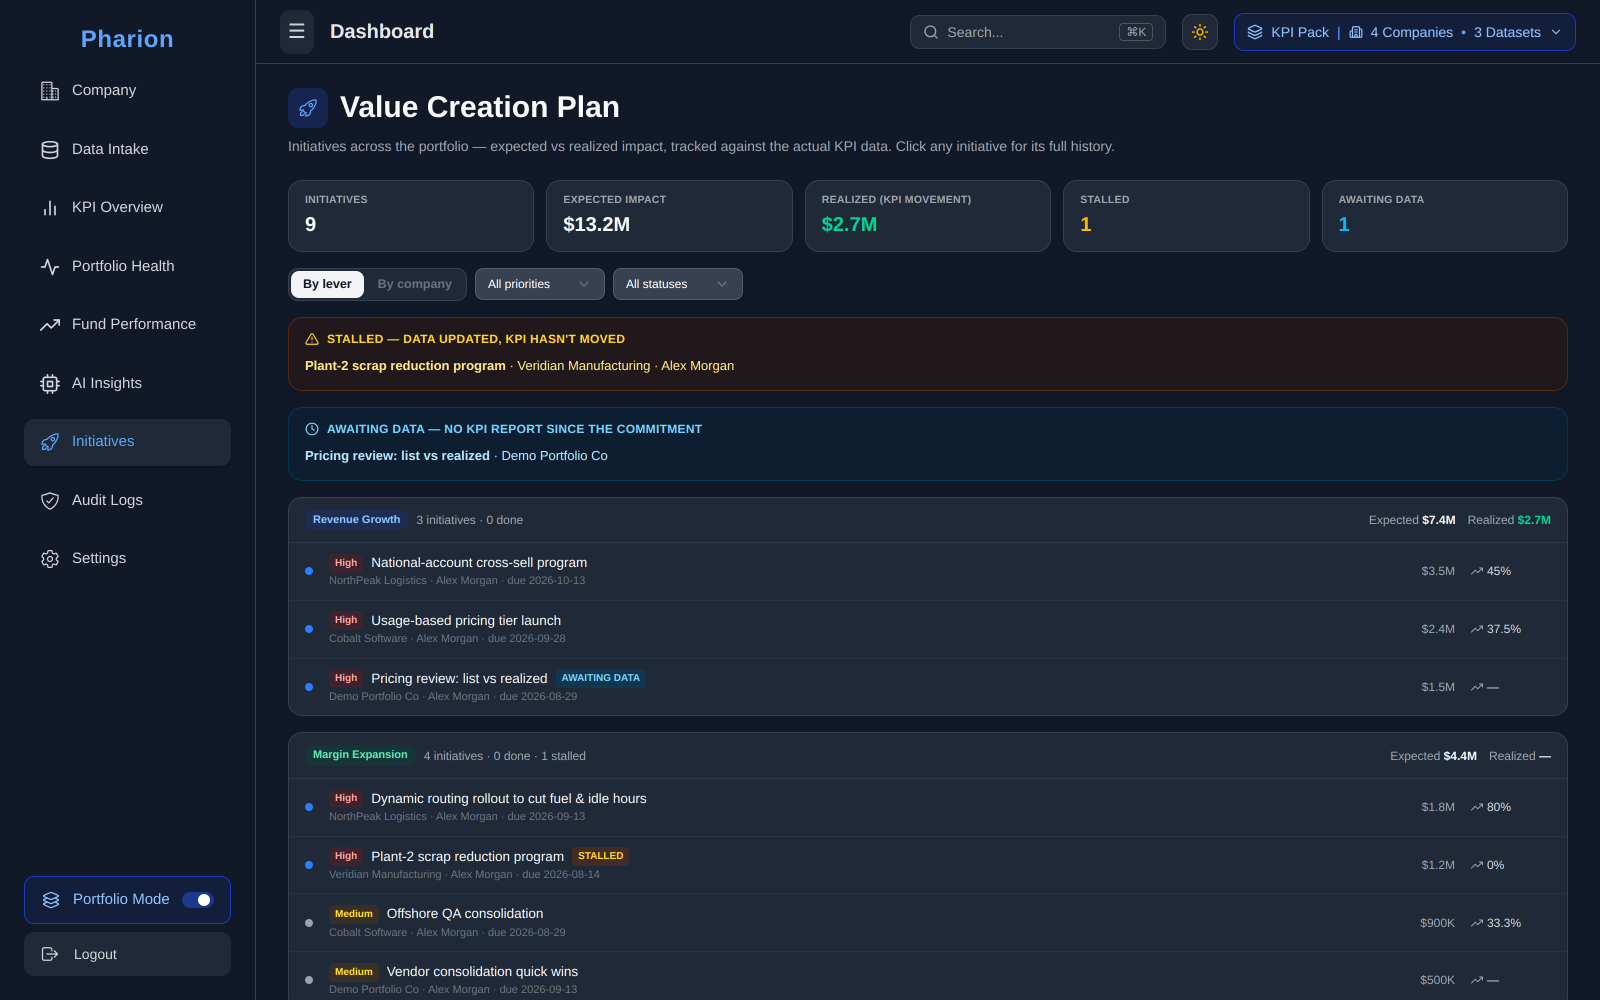
Initiatives
Hundred-day plans measured from the data companies actually report.
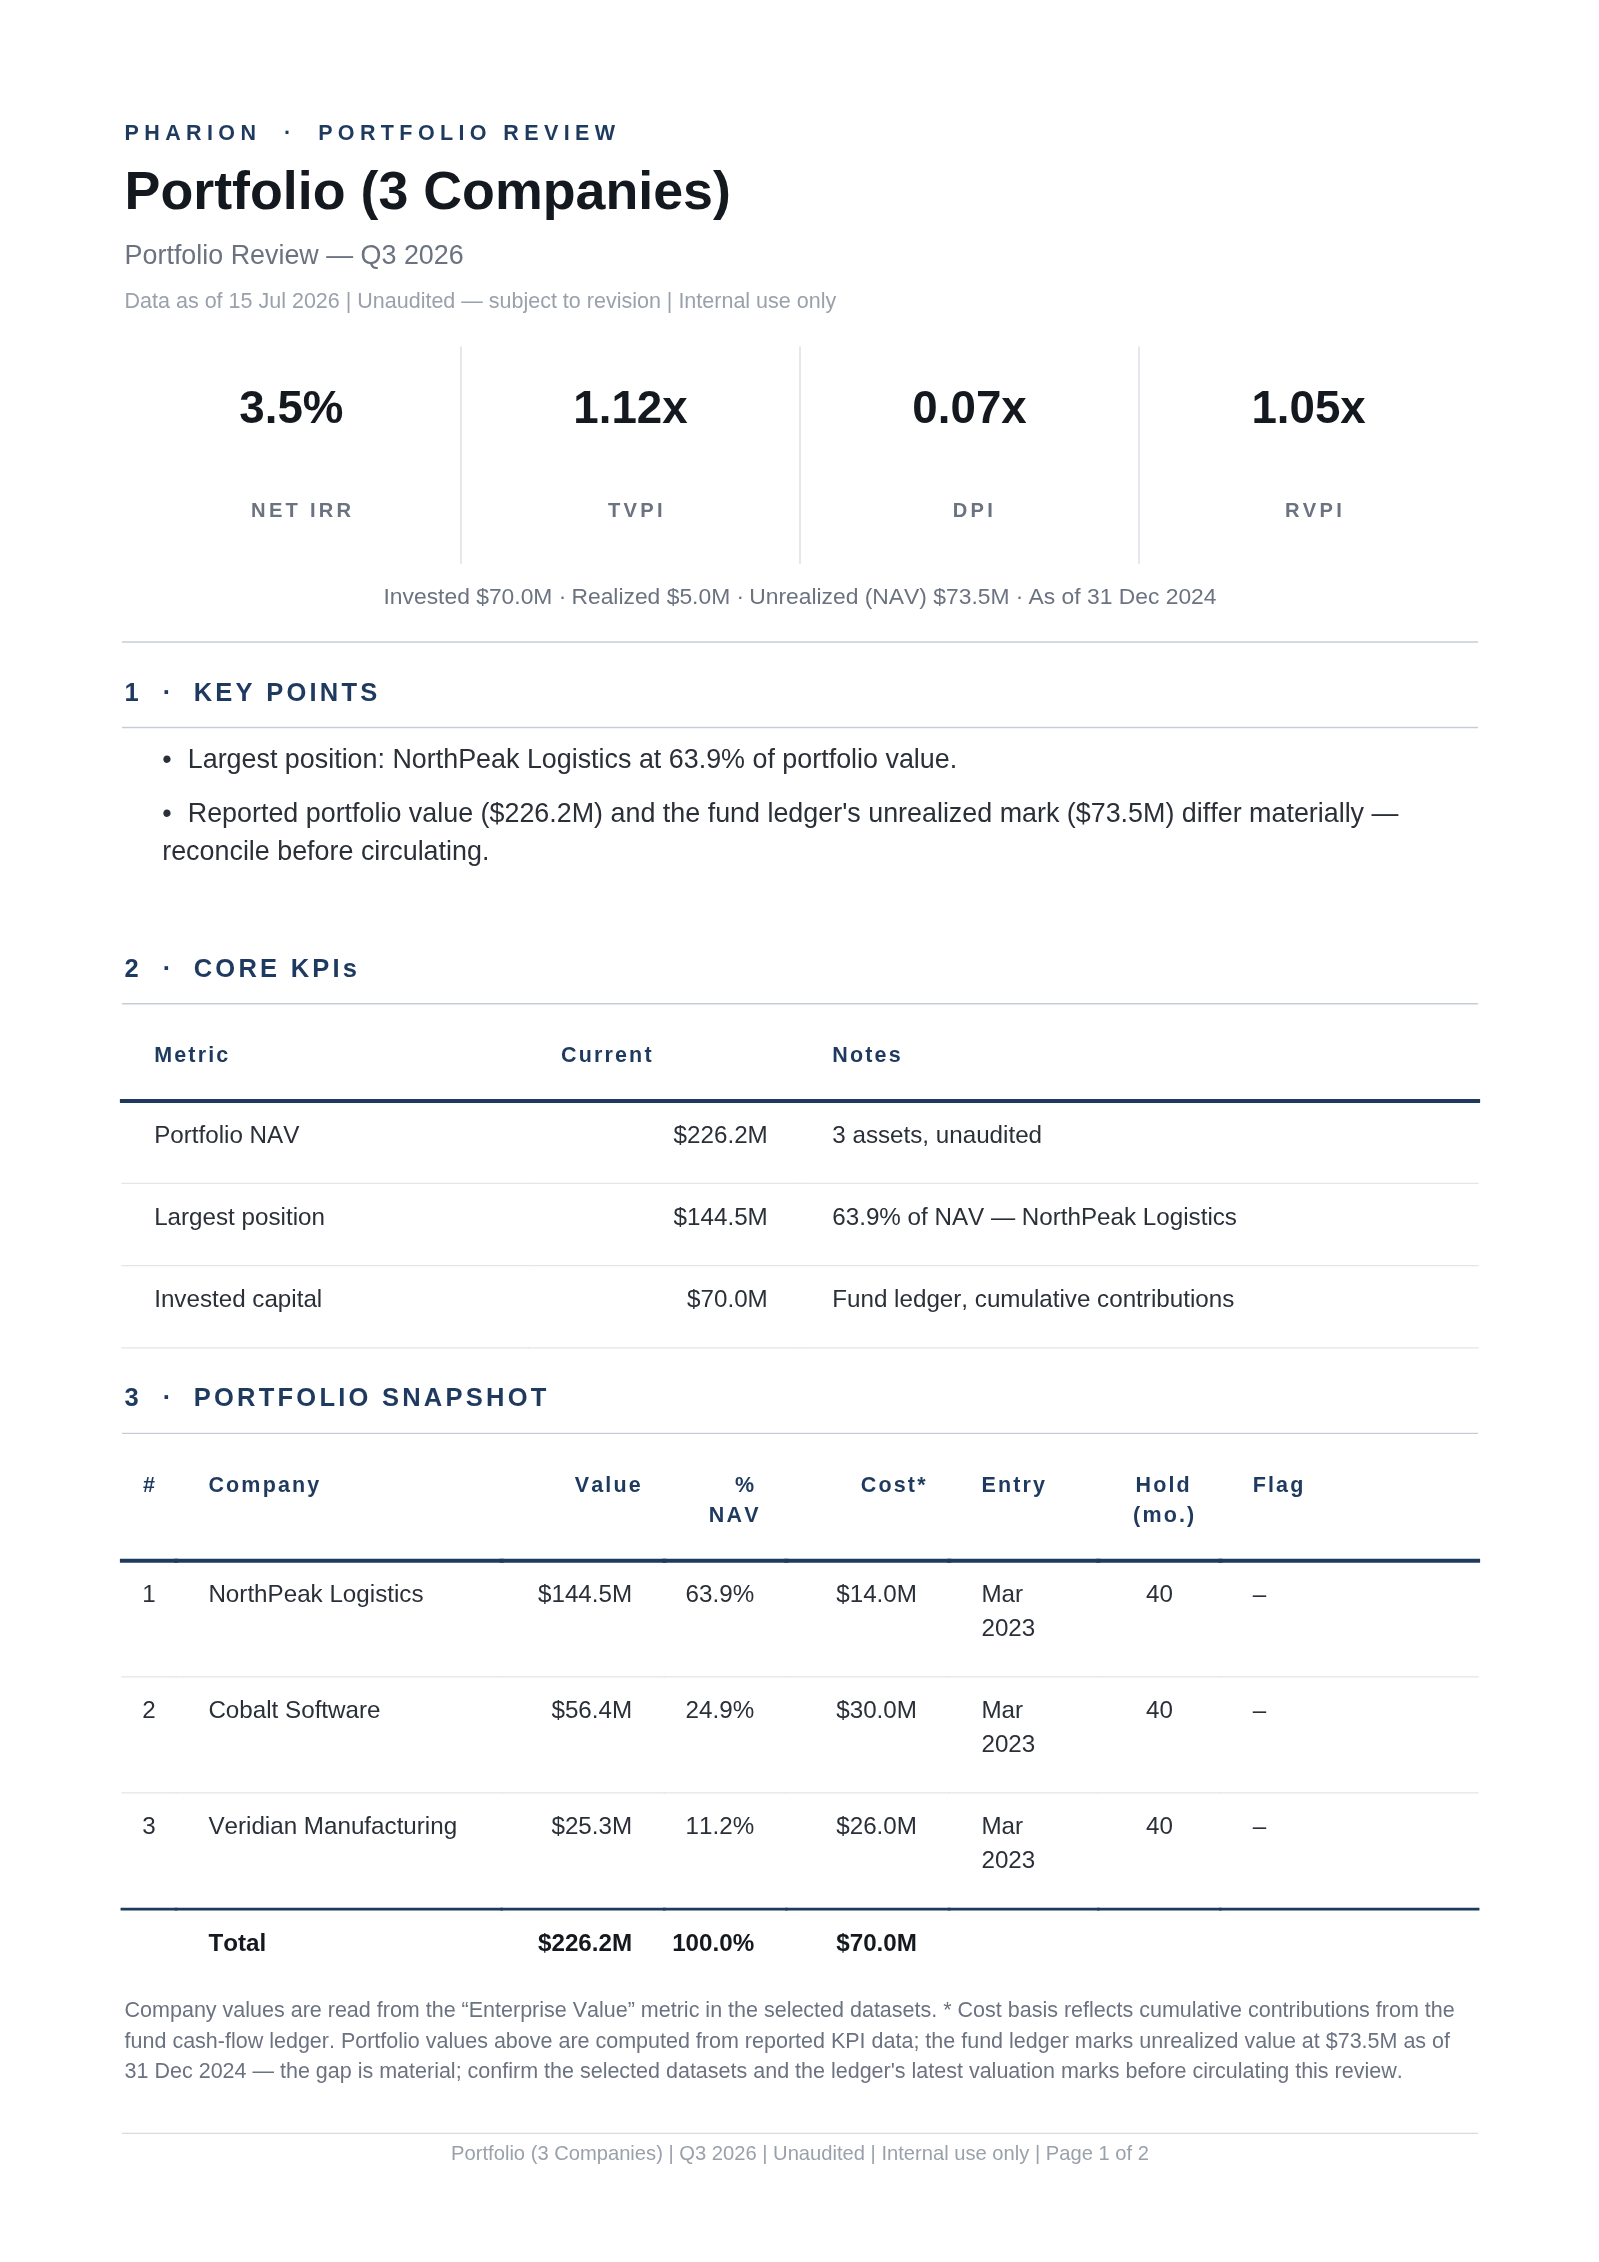
Board Exports
Boardroom memos with footnoted provenance, in one click.
Three steps to a live portfolio.
Connect your companies
Add your portfolio companies, invite your team, set roles. Setup takes minutes; there is no migration project.
Drop in the data you already have
Excel, CSV, or board documents, mapped to your KPIs once and remembered every quarter. Load past quarters too, so you start with trend lines instead of an empty dashboard.
Run the quarter from one screen
Live dashboards, health scores, tracked initiatives, and one-click board packs, all built from the numbers your companies actually report.
Built like infrastructure
Multi-tenant isolation, Microsoft sign-in, per-company encrypted keys, audit logs, and 100+ automated tests in CI. Read the security overview.
Portfolio data never leaves your tenant
AI analysis runs on your own Azure OpenAI key inside your own Azure tenant, and your data is never used to train models.
We’re onboarding design partners.
Pharion is young and moving fast. We’re working with a small number of firms who want portfolio reporting to take minutes instead of weeks, and who want a direct line to the people building their tooling. If that’s you, let’s talk.
Request a demo: Michael.Cieri@pharionanalytics.com